Visualization
Graphical Visualization
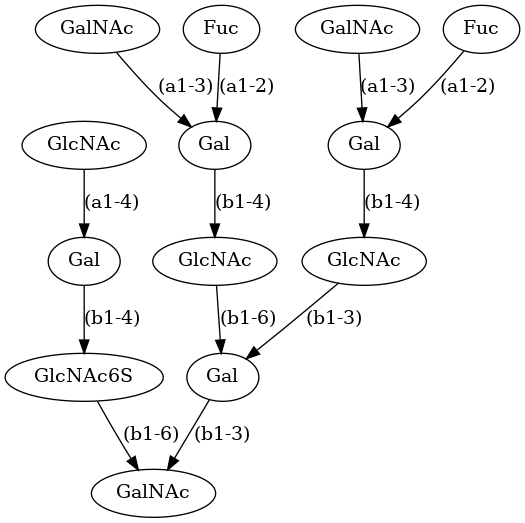
We can use GlyLES to visualize glycans on a monomer level. This is done by computing a graphical representation of the glycan in form of a DOT-graph of the monomeric tree-structure in vertical orientation …
[1]:
from glyles import Glycan
from IPython.display import Image


glycan = Glycan("Fuc(a1-2)[GalNAc(a1-3)]Gal(b1-4)GlcNAc(b1-3)[Fuc(a1-2)[GalNAc(a1-3)]Gal(b1-4)GlcNAc(b1-6)]Gal(b1-3)[GlcNAc(a1-4)Gal(b1-4)GlcNAc6S(b1-6)]GalNAc", tree_only=True)
Image(glycan.save_dot("files/viz.dot").create_png())
[1]:
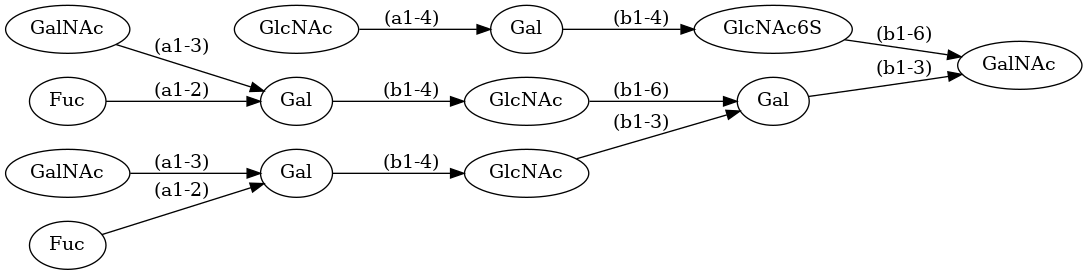
… or in horizontal orientation.
[2]:
Image(glycan.save_dot("files/viz_2.dot", horizontal=True).create_png())
[2]:
You can also get some statistics of a glycan
[4]:
for k, v in glycan.summary().items():
    print(k, ":", v)
formula : C92H153N7O67S
weight : 2459.850098435999
atoms : 167
bonds : 179
rings : 13
monomers : 13
types : {'GalNAc': 3, 'GlcNAc6S': 1, 'Gal': 4, 'GlcNAc': 3, 'Fuc': 2}
root : GalNAc
leaves : ['GlcNAc', 'GalNAc', 'Fuc', 'GalNAc', 'Fuc']
depth : 4